

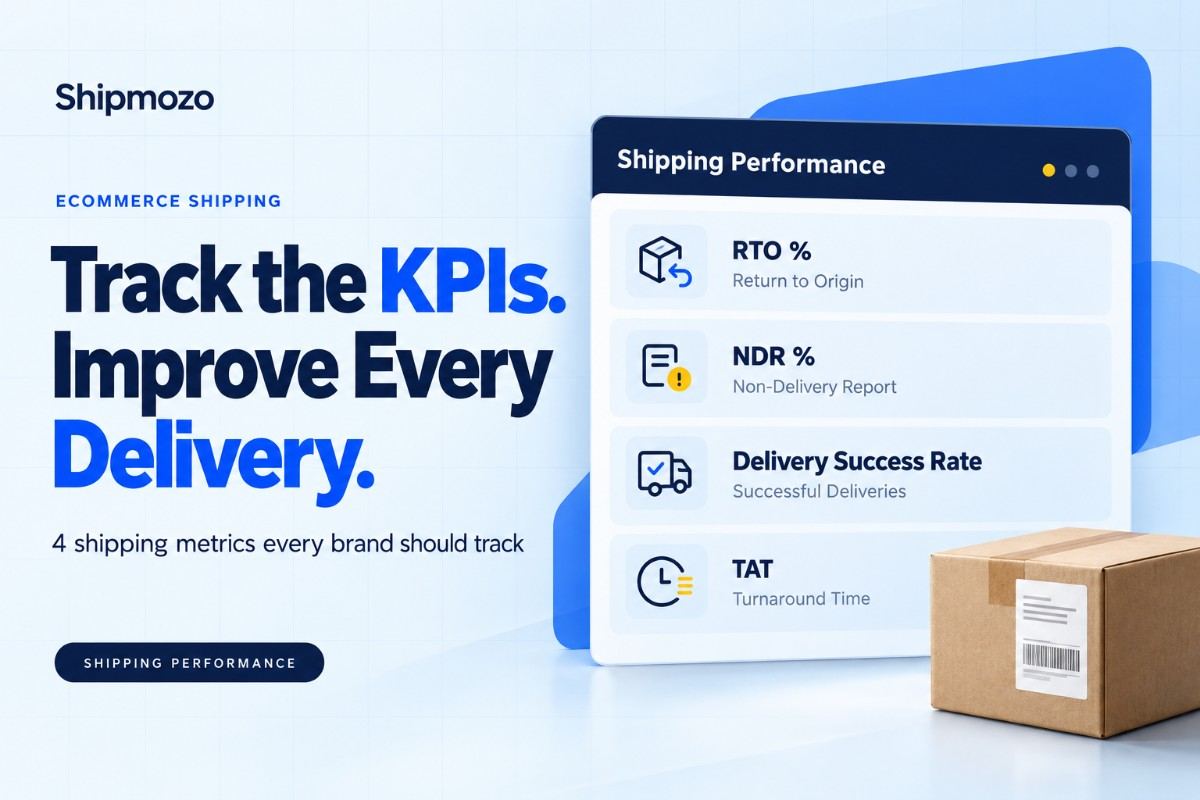
A dashboard full of numbers is not useful unless the team knows what each metric means, how it is calculated and what action should follow a change. A rising RTO percentage may indicate weak COD confirmation, poor address quality or repeated delivery attempts. A high NDR percentage can point to unreachable customers, incomplete addresses or insufficient communication. Longer TAT may reveal a courier, route, warehouse or order-processing issue.
This guide explains the core logistics KPIs for ecommerce businesses: RTO rate, NDR rate, delivery success rate and turnaround time. It also covers supporting measures such as first-attempt delivery, ageing shipments, courier-level performance and data segmentation. The objective is not to chase one universal number. It is to create a consistent operating rhythm where teams review data, identify causes and improve the shipping process.
For larger brands and growing D2C businesses, the most reliable approach is to measure these indicators by courier, zone, pincode, payment method, product category and order value. Aggregated averages often hide operational problems that become visible only after segmentation.
Shipping KPIs are measurable indicators used to evaluate the performance, cost, reliability and customer impact of order fulfilment and delivery operations. They convert shipment events into information that an ecommerce, logistics or customer support team can act on.
For example, “delivered” is a shipment status, but delivery success rate turns delivered orders into a performance measure. Similarly, “returned to origin” is an event, while RTO rate shows how frequently shipped orders fail to reach customers and come back to the seller.
The four primary indicators covered in this guide are:
The measurement window must be clearly defined. A report that combines orders booked this week with orders delivered this week may produce misleading results because the two groups have different shipment ages. Teams should decide whether the denominator is orders created, shipments manifested, shipments picked up or shipments that reached a delivery attempt.
Consistent definitions are especially important when comparing couriers. A carrier that receives more remote-area orders, COD shipments or bulky products may naturally show different results from a carrier handling prepaid metro orders. Like-for-like comparisons produce better decisions.
Delivery data has a direct operational and financial effect. When an order fails, the brand may lose forward shipping charges, pay return freight, block inventory during transit and spend additional time on customer support. If the product is seasonal, perishable or trend-sensitive, a delayed return can also reduce the opportunity to resell it.
RTO and NDR should therefore be read together. A high NDR rate does not always mean the order will become an RTO. A timely reattempt, customer confirmation or address correction may still result in delivery. However, unresolved NDR shipments are at higher risk of returning, making early intervention important.
TAT helps teams assess the customer promise. A brand may advertise a certain delivery window, but the actual experience can vary by pincode, courier and order type. Monitoring average TAT alone is not enough because a small number of severely delayed shipments can be hidden by fast deliveries. Percentile views, ageing buckets and serviceability segments provide more operational detail.
These metrics also support courier allocation. If one courier performs well for prepaid metro shipments but poorly in remote COD lanes, the answer may not be to stop using that courier entirely. It may be to route only suitable shipment profiles through that carrier and use another option for specific zones or payment types.
Brands can use courier performance metrics to compare service quality, delivery attempts, transit time and exceptions at a more granular level. That makes discussions with courier partners more evidence-based than relying on isolated complaints.
A structured KPI framework gives teams a common language. Operations, finance, customer support and leadership can review the same measures while focusing on different decisions. The value comes from connecting each metric to an owner and an action.
Metrics should never be treated as a scorecard detached from context. A temporary disruption, festival peak, weather event or serviceability change can affect the numbers. The right response is to annotate the data, compare relevant periods and investigate the operational cause.
The formulas below are simple, but the input data must be clean. Before calculating a metric, remove duplicate shipment records, define the reporting window and confirm which shipment statuses belong in the denominator.
For NDR-specific definitions, reattempt workflows and resolution tracking, brands can refer to NDR management. The key is to measure both the initial problem and the final outcome after intervention.
Good reporting is built around consistent data discipline. A dashboard cannot compensate for unclear status mapping or changing formulas. Ecommerce teams should establish a KPI dictionary that lists the definition, formula, data source, denominator, owner and review frequency for every metric.
Group shipments by the date they were shipped or picked up, then follow the cohort until it reaches a final outcome. This avoids comparing a mature shipment group with newly booked orders that are still in transit.
A shipment delivered after an NDR is not equivalent to a shipment delivered on the first attempt. Track both measures. First-attempt delivery highlights delivery readiness, while final delivery success shows the overall outcome after reattempts.
Average TAT is easy to understand but can conceal outliers. Median TAT shows the middle shipment experience, while a higher percentile helps reveal the slower tail that creates customer complaints and support tickets.
Payment method can influence customer availability, refusal behaviour and delivery success. A blended number may hide a COD-specific problem. Review RTO, NDR and TAT separately for prepaid and COD shipments.
Do not wait for a month-end report to identify stalled orders. Create ageing buckets for shipments with no movement, repeated NDR, delayed pickup, delayed handover or extended in-transit periods. Early escalation gives the team more options.
Shipping KPIs become more useful when reviewed alongside cancellation rate, support contacts, refunds, repeat purchases and product returns. A delivery issue may be visible in support tickets before it appears in a monthly logistics report.
Real-time status visibility helps teams identify exceptions while the shipment can still be influenced. Brands can use real time tracking to improve internal coordination and give support teams a clearer answer when customers ask about an order.
National averages are rarely enough for practical decisions. Compare origin warehouse, destination zone, service type, courier and pincode. This helps identify whether the issue sits in fulfilment, line haul, last-mile delivery or customer communication.
Many reporting problems come from measurement design rather than courier performance. Avoiding these mistakes improves the quality of decisions made from the dashboard.
Brands should also avoid overreacting to a single week. Investigate sudden changes, but confirm whether they are sustained, concentrated in a particular segment or caused by a temporary event.
Each metric answers a different operational question. Teams should prioritise the indicator closest to their current business problem, while continuing to monitor the full set.
For example, a brand with stable RTO but increasing customer complaints may need to study TAT and delayed scans. A brand with long TAT but strong final delivery may need better promise-setting and lane-level courier allocation. A brand with rising RTO should inspect NDR reasons, COD confirmation, address quality and customer communication before changing every courier relationship.
Using a multi-courier shipping platform can make these comparisons easier when orders are distributed across different delivery partners. The important requirement is consistent status data and a reporting view that allows like-for-like comparisons.
The most useful shipping dashboard is not the one with the largest number of charts. It is the one that helps an ecommerce team answer practical questions: Which orders are at risk, where are failures concentrated, which courier or lane needs attention, and what should happen next?
Start with RTO rate, NDR rate, delivery success rate and TAT. Define each formula, use consistent cohorts, segment results by operational variables and connect every finding to an owner. Over time, add supporting measures such as first-attempt delivery, ageing shipments, courier performance and exception resolution.
Shipmozo supports businesses with analytics and reporting for shipment performance, along with B2C shipping and B2B logistics capabilities for different fulfilment requirements. These capabilities help teams bring operational data into a more structured review process instead of relying on fragmented courier updates.
Use shipping kpis ecommerce teams can define consistently, then turn the findings into better routing, communication and exception management decisions. Talk to an Expert
The core measures are RTO rate, NDR rate, delivery success rate and TAT in shipping. Brands should also review first-attempt delivery, shipment ageing and courier-level performance to understand the causes behind the headline numbers.
The RTO rate formula is RTO orders divided by total shipped orders, multiplied by 100. The denominator should be defined clearly and used consistently across reporting periods.
The NDR rate formula is orders with an NDR event divided by orders that reached a delivery attempt, multiplied by 100. NDR should be measured separately from final RTO because an NDR shipment may still be delivered after intervention.
The delivery success rate formula is successfully delivered eligible orders divided by total eligible shipped orders, multiplied by 100. Brands should document how they treat cancelled, in-transit and customer-held orders.
TAT in shipping means turnaround time. It measures the time between two defined events, such as pickup and delivery or order confirmation and delivery. Teams should state the start and end points when reporting TAT.
Yes. Courier-level reporting helps identify differences in delivery success, NDR, RTO and TAT. The comparison should also account for shipment mix, including zone, pincode, payment method, product type and order value.


Ankit Debnath is a sales and marketing professional with 4+ years of experience in the logistics industry, specializing in managing B2B and B2C key accounts. At Shipmozo, he focuses on driving growth through client acquisition, lead generation, and strategic relationship management. Passionate about building strong client relationships and delivering results, he brings a practical, growth-oriented approach to logistics and business expansion.