

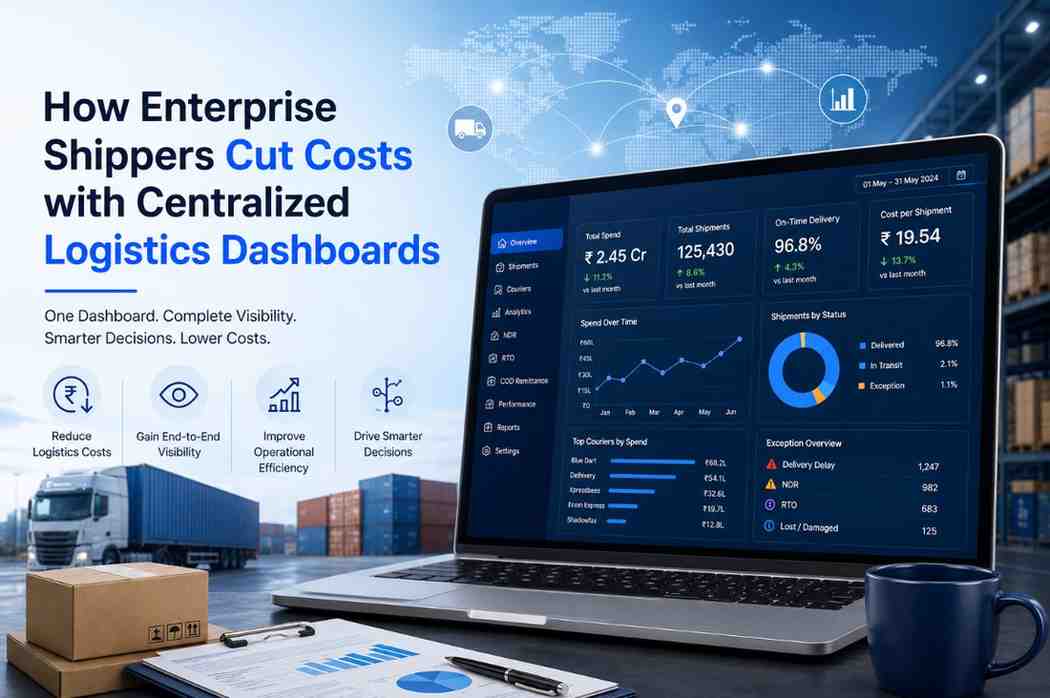
Large shippers rarely lose money from one obvious logistics error. Cost usually builds across disconnected courier contracts, manual allocation decisions, duplicate data entry, delayed exception handling, billing discrepancies, and limited visibility across business units. An enterprise shipping dashboard brings these operational inputs into one place so logistics teams can identify leakage and act before it becomes a recurring expense.
For manufacturers, distributors, wholesalers, and high-volume ecommerce businesses, centralisation is not only about having a cleaner interface. It creates a common operating layer for order processing, courier selection, tracking, billing review, and performance management. Teams can work from consistent shipment data instead of reconciling separate courier portals and spreadsheets.
The financial benefit comes from better decisions. A central system can help a business use the appropriate service mode, compare carrier performance, identify costly delivery exceptions, and reduce repetitive administrative work. It does not remove every logistics cost, but it gives decision-makers the information and control needed to manage those costs more deliberately.
This guide explains how centralised logistics dashboards support enterprise cost control, which workflows should be connected first, how to measure the impact, and what mistakes can limit the value of the investment.
An enterprise shipping dashboard is a central logistics workspace that helps a business manage shipments moving through multiple couriers, service modes, locations, channels, and fulfilment teams. Instead of treating every carrier portal as a separate source of truth, the business uses one operational view to coordinate shipping activity.
The dashboard may connect order information with shipment creation, courier allocation, tracking events, delivery exceptions, billing records, and return activity. The exact workflow depends on the platform and the organisation's integrations. The important principle is that teams can access relevant logistics information without repeatedly switching systems or manually compiling reports.
For an enterprise, centralisation must support more than label generation. It should help different stakeholders answer practical questions:
A unified platform is especially useful when a company handles a mix of B2B shipping, B2C orders, surface movement, air consignments, PTL, LTL, FTL, or international shipments. Each mode has different cost drivers and service expectations, so a single view helps teams compare operations without confusing unlike shipments.
Shipping cost control depends on timely, accurate operational information. If a finance team sees a surcharge weeks after dispatch, or an operations team discovers a recurring failed-delivery pattern only after customer complaints increase, the opportunity to prevent the cost has already narrowed.
Fragmented systems create three common problems. First, teams spend time collecting and cleaning data instead of managing exceptions. Second, different departments may use different shipment counts, status definitions, or cost calculations. Third, management may see an average cost that hides expensive lanes, products, customers, or delivery outcomes.
A central view improves the speed between an event and a decision. For example, an operations manager can investigate whether delays are concentrated with one carrier, one destination group, or one service mode. A billing team can examine a weight discrepancy against the original shipment details. A customer service agent can check tracking information without waiting for another department to respond.
Centralisation also supports accountability. When shipment events and actions are recorded in one workflow, teams can identify whether an issue came from packaging, address quality, courier selection, pickup failure, delivery execution, or internal processing. This distinction matters because each cause requires a different corrective action.
Businesses that already use multiple carriers can also benefit from managing multiple couriers through a coordinated process. The goal is not to send every shipment to the cheapest available option. It is to select a commercially sensible option after considering serviceability, shipment characteristics, delivery requirements, reliability, and the consequences of failure.
Manual shipment entry, repeated status checks, spreadsheet updates, and invoice matching consume skilled employees' time. A central workflow reduces unnecessary handoffs and gives teams a consistent place to complete routine actions. The resulting saving may appear as fewer manual hours, faster processing, or the ability to handle higher volume without adding the same level of administrative effort.
When carrier selection depends on individual preference or habit, the business may overuse one service even when another is more suitable. A centralised system makes allocation rules easier to apply consistently. Teams can consider destination, package weight, service type, delivery priority, and operational history before assigning a shipment.
Shipmozo's AI Courier Allocation is relevant where businesses want technology-assisted carrier selection rather than relying entirely on manual decisions. It should be managed with clear business rules and reviewed against actual outcomes.
Shipping invoices can contain differences related to billed weight, zone, additional handling, remote-area charges, or other adjustments. A central record makes it easier to compare the shipment's original information with the amount eventually charged. Not every difference is incorrect, but unexplained differences deserve investigation.
Finance and logistics teams can use this information to identify recurring patterns. For example, repeated weight discrepancies may indicate inaccurate package dimensions, inconsistent weighing practices, or a courier measurement issue. Each cause has a different solution, and visibility helps prevent assumptions.
Undelivered shipments, failed delivery attempts, address issues, and delayed scans can create additional freight costs and customer-service work. Early visibility gives teams more time to take appropriate action, such as contacting the consignee, correcting information, scheduling a reattempt, or reviewing the shipment with the carrier.
For businesses handling a high number of exceptions, a structured NDR management process can help separate cases that need customer intervention from cases that require courier escalation.
Leadership needs more than total freight spend. Useful reporting should connect cost with shipment volume, service type, destination, carrier, delivery outcome, return activity, and billing adjustments. A central dashboard creates a stronger base for these reviews because the data comes from the same operational process.
Technology alone does not reduce logistics costs. The business needs a defined implementation process that connects the system to measurable operating decisions. The following sequence is practical for an enterprise shipping operation.
Different systems may identify an order, package, invoice, and airway bill in different ways. Establish a consistent relationship between these references so teams can trace one shipment from booking to delivery and billing. This is essential when one customer order is split into multiple packages or moves through different service modes.
Operations should own shipment execution and exception handling. Finance should own invoice review, reconciliation, and payment controls. Both teams need access to the same underlying information, but their responsibilities should remain clear. This prevents billing issues from being treated as purely operational problems or shipment delays from being left with finance.
Total freight spend can rise simply because shipment volume increased. Review cost per order, package, kilogram, consignment, or customer account where appropriate. For B2B movements, a cost-per-consignment view may be more useful than a cost-per-order view. The measurement should match the commercial model.
Shipping charges may depend on dead weight, volumetric weight, or both. Teams should capture package dimensions accurately and compare them with carrier-billed information where possible. Packaging changes, weighing controls, and staff training can often address repeated discrepancies more effectively than negotiating rates alone.
A clear understanding of volumetric weight helps logistics managers explain why a lightweight but oversized parcel may cost more than expected.
A dashboard should make failed pickups, delayed scans, NDR cases, returns, and claims visible. These events often generate indirect costs through reattempts, customer support, reverse movement, replacement shipments, and inventory handling. Include them in management reviews so cost reduction does not focus only on the initial freight charge.
Teams are more likely to trust automated or technology-assisted allocation when they understand the factors influencing the decision. Document the operating logic and review it when carrier coverage, service levels, business priorities, or product characteristics change. Human review remains important for unusual or high-value shipments.
Incorrect pincodes, incomplete addresses, inconsistent weights, and duplicate orders can undermine any reporting system. Build validation checks into order processing and make it easy for teams to correct errors. A central dashboard can expose poor data, but it cannot compensate for inaccurate source information.
A lower freight rate may be offset by higher delays, failed deliveries, claims, returns, or customer-service contacts. Enterprise decisions should consider the full cost of the shipment journey. Compare carriers using both commercial and service outcomes instead of ranking them on price alone.
Shipment visibility is valuable, but tracking is only one part of cost control. If teams do not review allocation, billing, exceptions, returns, and mode selection, the platform becomes a status screen rather than a management tool. Define actions that must follow each important alert or report.
One location may have accurate weighing processes while another regularly creates dimension adjustments. One warehouse may dispatch on time while another misses pickup cut-offs. Enterprise reporting should allow teams to compare locations and identify process variation rather than hiding it inside a national average.
Rules that work for routine parcels may not suit fragile goods, high-value consignments, oversized products, urgent B2B shipments, or international orders. Keep exception paths for shipments that require a human decision. Automation should reduce repetitive work while preserving control over unusual risk.
COD collections and reverse shipments affect cash flow as well as freight expense. If remittance, delivery status, return movement, and order records are not reconciled, the business may misread its actual profitability. A structured COD reconciliation process helps finance teams match expected and received amounts.
Counting dashboards opened, reports generated, or shipments processed does not prove that costs are under control. Measure outcomes such as fewer billing discrepancies, lower avoidable reattempts, improved pickup adherence, reduced manual handling, and more appropriate carrier utilisation. The exact indicators should reflect the business's operating model.
Both models can process shipments, but they create different levels of control. The comparison below focuses on the operational consequences for an enterprise team.
The centralised model is not automatically better for every shipment. Its value depends on data quality, process adoption, integration coverage, and disciplined performance reviews. Enterprises should begin with high-volume workflows where fragmented management creates visible administrative or financial leakage, then expand after the process is stable.
An enterprise shipping dashboard helps large shippers control cost by connecting operational visibility with practical decisions. It can reduce duplicated work, make courier allocation more consistent, highlight billing discrepancies, and help teams act earlier on delivery exceptions. The strongest results come when the dashboard is treated as an operating system for logistics management rather than a reporting screen.
Shipmozo supports this approach with Multi Courier Shipping, AI Courier Allocation, the Billing Module, and COD Reconciliation. Together, these capabilities are relevant for enterprises managing multiple carriers, shipment modes, finance checks, and high-volume delivery workflows. Review your current process, identify the largest sources of leakage, and build a centralised operating model around those priorities.
Talk to an Expert
It is a central logistics workspace that helps large businesses manage shipment creation, courier allocation, tracking, exceptions, billing information, and related workflows across multiple carriers and locations.
It can reduce avoidable administrative work, support more consistent courier allocation, expose billing discrepancies, and give teams earlier visibility into delivery exceptions, returns, and other events that create additional expense.
No. A low freight rate may be offset by delays, failed delivery attempts, returns, claims, reattempts, or additional customer-service work. Enterprises should assess freight price together with operational and service outcomes.
Useful data includes shipment volume, freight cost, service mode, carrier, destination, billed weight, delivery outcome, exception volume, return activity, COD records, and additional charges. The exact metrics should match the company's shipping model.
It can support routine allocation decisions, but human review remains important for high-value, unusual, oversized, urgent, fragile, or international shipments. Allocation rules should be documented and reviewed against actual performance.
Start by mapping the existing workflow, defining cost categories, connecting important order and courier sources, setting allocation and escalation rules, creating role-specific views, and reviewing performance on a fixed schedule.


Diveya Mehta is a marketing and content specialist with 3+ years of experience, currently working with Shipmozo. With 1 year of hands-on experience in logistics, she creates practical, insight-driven content focused on shipping, courier performance, and eCommerce growth.





.webp)